CityPy Dataset Randomness
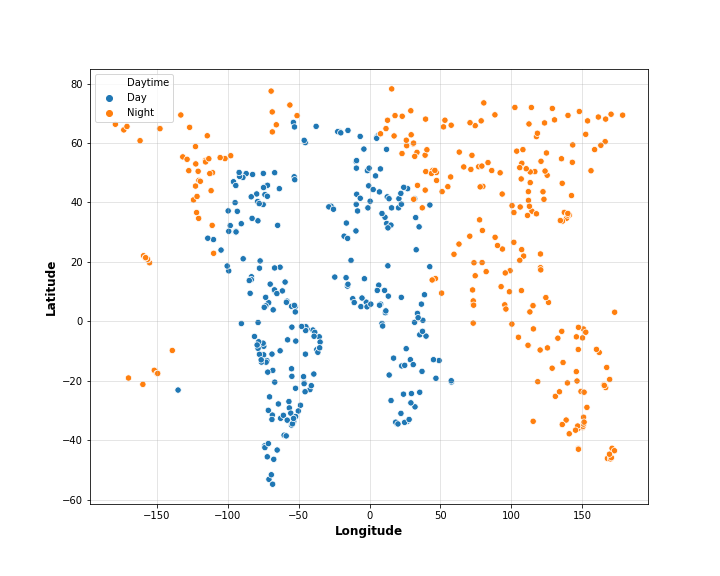
- The dataset originated with a random array of valid latitude and longitude coordinates, then the nearest city was found using CityPy. In order to demonstrate that the dataset was truly random, all cities were plotted by Latitude and Longitude to check that the data were representative of global land masses.
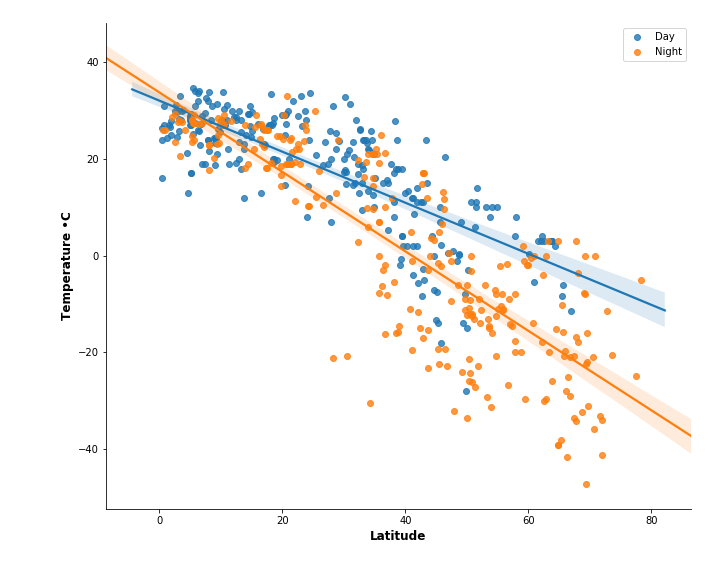
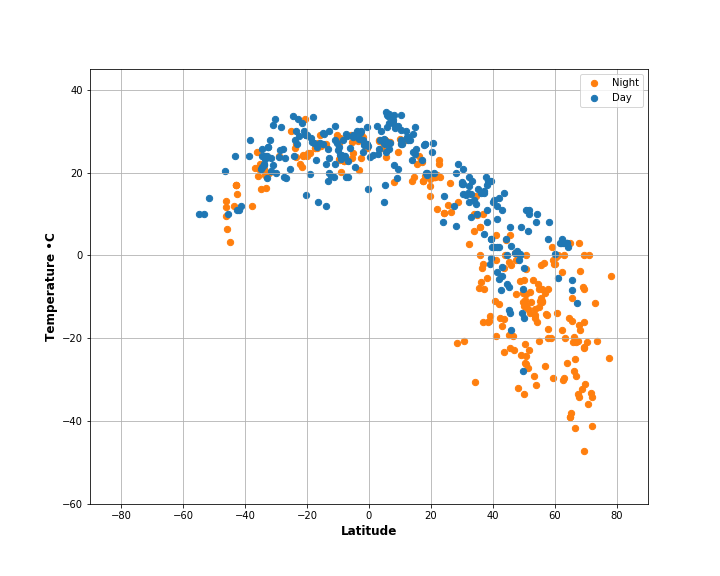
- The dataset was binned by whether the time of measurement was between sunrise and sunset to determine daytime/nighttime for each city. Regions in daylight at the time of measure (January 7, 2019 at 14:00GMT) are seen in blue, those in darkness are shown in orange.
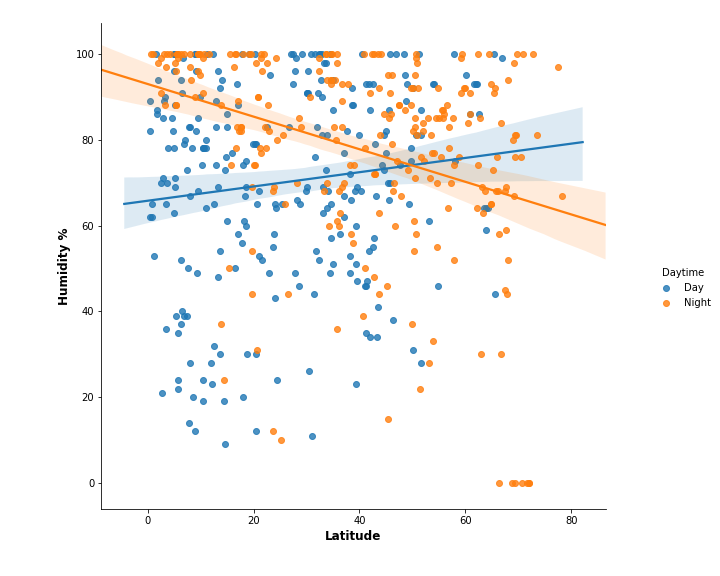
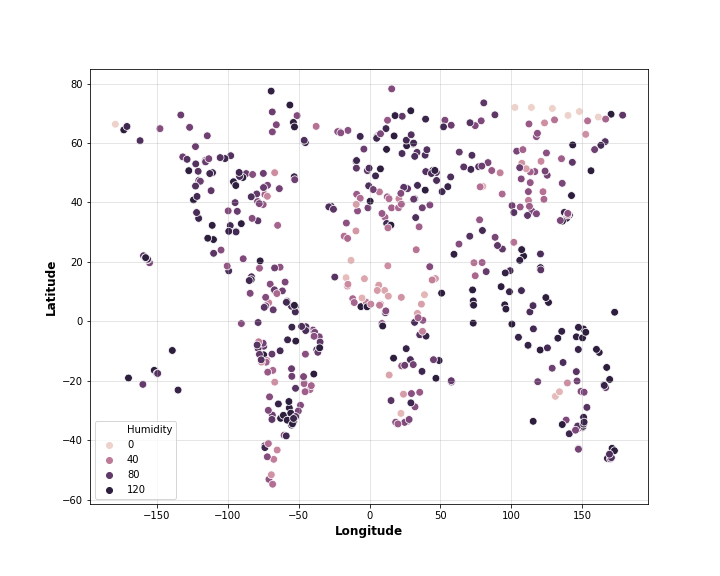
Humidity
In the plot of humidity, desert regions are visible by a cluster of cities with low humidity, in particular in Northern Africa.
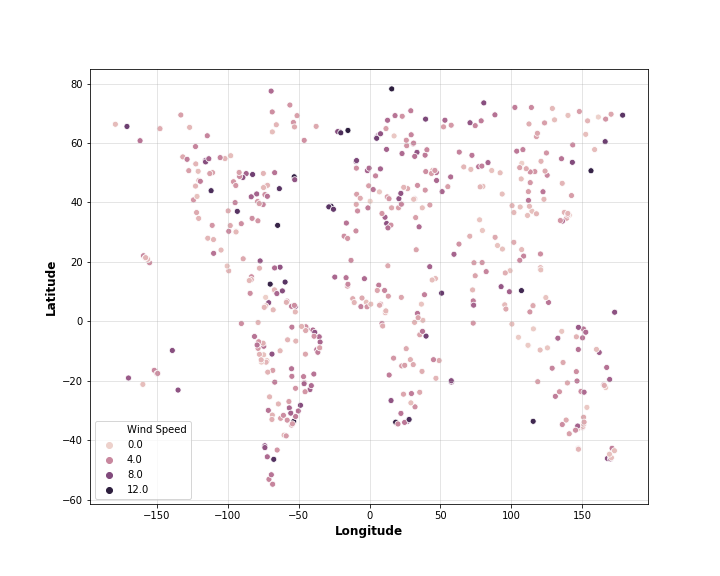
Wind Speed
There seemed to be no overall patterns for wind from this plot, as the wind speeds are quite localized.
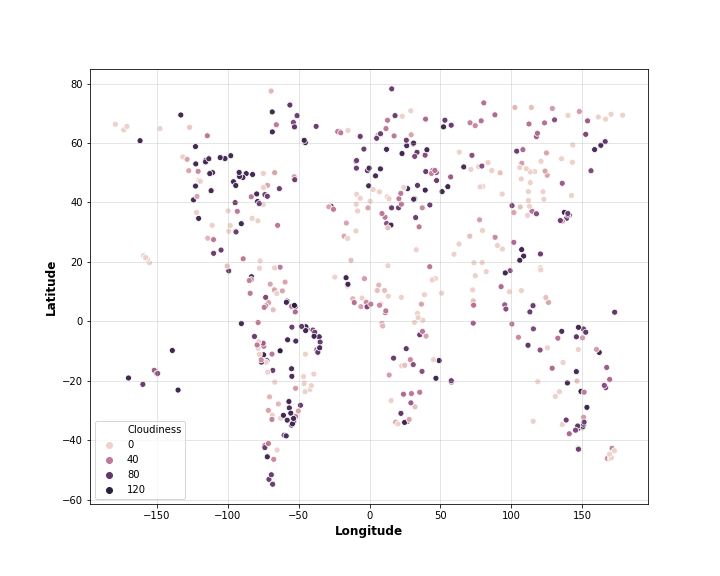
Cloudiness
Regions of cloudiness are visible across North America, Northern Europe and South America, but overall cloudiness was localized.
Visualizations